WARRRIORS FOOTBALLL
MIKE BURLEY / MBURLEY@STARBULLETIN.COM
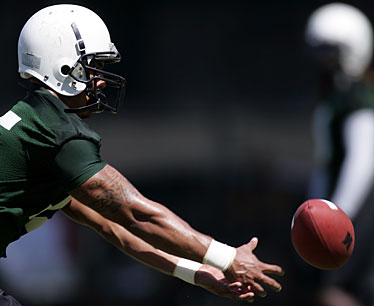
Kaeo Monteilh, shown practicing during fall camp, led the Warriors in tackles against Oregon State last Saturday with 10 along with David Veikune and Solomon Elimimian. Tackling is not a pressing problem at this point for Hawaii, which needs work on takeaways, turnover margin and third-down conversions. UH returns to action in two weeks at home against San Jose State.
|
|
UH woeful in 3 key stats
Statistics rarely illustrate the entire picture of the pointillist painting that is a college football game.
Still, certain figures can accentuate the telling features, and a few catch the eye in examining Hawaii's sixth 1-2 start in the last eight years.
The Warriors returned home yesterday at the bottom of the national rankings in turnover margin and third-down conversions, two factors UH coach Greg McMackin pointed to in reviewing last Saturday's 45-7 loss at Oregon State.
Hawaii is tied with Rutgers for 118th (out of 119 Football Bowl Subdivision teams) in turnover margin at minus-three per game, and the Warriors' 11 giveaways are the most in the country.
The Warriors also struggled to sustain drives after scoring on their opening possession against Oregon State, going 1-for-11 on third downs. Overall, the Warriors' third-down rating of 15.2 percent (5-for-33) lands them 119th.
"We talked before the game that we had to win third-down situations on both sides of the ball and we had to win the turnover battle," UH coach Greg McMackin said. "And you have to give credit to Oregon State for winning those two things.
"Those are important statistics and those are two areas we really have to improve on. We're going to put them in competitive situations in practice to work on those."
Of UH's 11 turnovers, eight have set up opponent touchdowns, including two interception returns for scores by Florida. Oregon State converted all three UH interceptions into touchdowns on Saturday.
Third-down percentage can sometimes be a deceiving statistic, evidenced by UH's 2-for-11 performance in a 36-17 win over Weber State.
But their struggles on Saturday helped dictate the flow of the game as Oregon State pulled away from the Warriors.
"Sometimes when this offense is on, you don't get to a lot of third downs," UH quarterbacks coach Nick Rolovich said. "In our offense you can be a little bit less than average on third down because you're getting so many big plays on first down and second down. But when it's that low, the offense is struggling, and you're not converting third downs, it's not a good sign."
Third-down conversions were an issue for Oregon State going into the game, and the Beavers responded by going 8-for-17 on their way to controlling the ball for more than 37 minutes in their first win of the season.
"Third-down conversions are the meat of our offense - that's basically where we make our money," OSU quarterback Lyle Moevao said.
Defensively, the Warriors have two interceptions to their credit so far and rank 73rd nationally in defending third downs, with opponents converting 40.5 percent.
Third downs were a strength for the Warriors last year when they finished 10th in the country offensively and sixth defensively.
"Those are big. That's one of the goals, to hold them under 38 percent on third downs," UH linebacker Adam Leonard said. "(Against Weber State) we did a great job of doing that. ... When the offense manages to get a first down it helps build their confidence. We've got to use that for our momentum, and (against Oregon State) they just managed to get more than we wanted."
Hawaii Football Statistics
Team Statistics
|
|
Hawaii |
OPP
|
| FIRST DOWNS |
53 |
118
|
| Rushing |
17.7 |
39.3
|
| Passing |
51 |
62
|
| Penalty |
8 |
5
|
| RUSHING YARDAGE |
250 |
452
|
| Yards gained rushing |
338 |
569
|
| Yards lost rushing |
88 |
117
|
| Rushing attempts |
78 |
114
|
| Average per rush |
3.2 |
4.0
|
| Average per game |
83.3 |
150.7
|
| Touchdowns rushing |
3 |
8
|
| PASSING YARDAGE |
640 |
652
|
| Att-Comp-Int |
108-57-7 |
93-54-2
|
| Average per pass |
5.9 |
7.0
|
| Average per catch |
11.2 |
12.1
|
| Average per game |
213.3 |
217.3
|
| Touchdowns passing |
4 |
5
|
| TOTAL OFFENSE |
890 |
1104
|
| Total plays |
186 |
207
|
| Average per game |
296.7 |
368.0
|
| KICK RETURNS: No-Yds |
20-363 |
6-164
|
| PUNT RETURNS: No-Yds |
4-(-2) |
8-173
|
| INT. RETURNS: No-Yds |
2-11 |
7-126
|
| FUMBLES-LOST |
6-4 |
4-0
|
| PENALTIES-YARDS |
24-211 |
28-236
|
| PUNTS-AVG |
16-678 |
12-531
|
| TIME OF POSSESION/GAME |
29:16 |
30:44
|
| 3RD-DOWN CONVERSIONS |
5/33 |
17/42
|
| 4TH-DOWN CONVERSIONS |
2/4 |
4/7 |
RUSHING
|
|
G |
Att |
Net |
Avg |
TD |
Long
|
| Rego |
3 |
13 |
71 |
5.5 |
0 |
19
|
| Wright-Jackson |
3 |
13 |
67 |
5.2 |
1 |
22.3
|
| Pilares |
3 |
18 |
66 |
3.7 |
2 |
22.0
|
| Libre |
2 |
9 |
46 |
5.1 |
0 |
23.0
|
| Funaki |
3 |
14 |
42 |
3.0 |
0 |
14.0
|
| TEAM |
1 |
1 |
-1 |
-1.0 |
0 |
-1.0
|
| Graunke |
2 |
2 |
-3 |
-1.5 |
0 |
-1.5
|
| Rausch |
1 |
1 |
-4 |
-4.0 |
0 |
-4.0
|
| Peoples |
3 |
2 |
-5 |
-2.5 |
0 |
-1.7
|
| Alexander |
1 |
5 |
-29 |
-5.8 |
0 |
-29.0
|
| Total |
3 |
78 |
338 |
3.2 |
3 |
83.3 |
PASSING
|
|
G |
Att |
Comp |
Int |
Yds |
TD |
Long
|
| Graunke |
2 |
47 |
25 |
2 |
336 |
3 |
42
|
| Funaki |
3 |
33 |
19 |
2 |
233 |
1 |
33
|
| Alexander |
1 |
21 |
11 |
2 |
57 |
0 |
12
|
| Rausch |
1 |
7 |
2 |
1 |
14 |
0 |
9
|
| Total |
3 |
108 |
57 |
7 |
640 |
4 |
42 |
RECEIVING
|
|
G |
Rec |
Yds |
Avg |
TD |
Long
|
| Washington |
3 |
16 |
198 |
12.4 |
0 |
33
|
| Salas |
3 |
10 |
143 |
14.3 |
1 |
41
|
| Bain |
3 |
8 |
61 |
7.6 |
2 |
23
|
| Pilares |
3 |
7 |
43 |
6.1 |
0 |
12
|
| Wright-Jackson |
3 |
5 |
47 |
9.4 |
0 |
20
|
| Lane |
3 |
4 |
65 |
16.2 |
1 |
42
|
| Medeiros |
3 |
4 |
39 |
9.8 |
0 |
24
|
| Taylor |
3 |
2 |
38 |
19.0 |
0 |
26
|
| Libre |
2 |
1 |
6 |
6.0 |
0 |
6
|
| Total |
3 |
57 |
640 |
11.2 |
4 |
42 |
TOTAL OFFENSE
|
|
G |
Plays |
Rush |
Pass |
Tot |
Avg
|
| Graunke |
2 |
49 |
-3 |
336 |
333 |
166.5
|
| Funaki |
3 |
47 |
42 |
233 |
275 |
91.7
|
| Rego |
3 |
13 |
71 |
0 |
71 |
23.7
|
| Wright-Jackson |
3 |
13 |
67 |
0 |
67 |
22.3
|
| Pilares |
3 |
18 |
66 |
0 |
66 |
22.0
|
| Libre |
2 |
9 |
46 |
0 |
46 |
23.0
|
| Alexander |
1 |
26 |
-29 |
57 |
28 |
28.0
|
| Rausch |
1 |
8 |
-4 |
14 |
10 |
10.0
|
| TEAM |
1 |
1 |
-1 |
0 |
-1 |
-1.0
|
| Peoples |
3 |
2 |
-5 |
0 |
-5 |
-1.7
|
| Total |
3 |
186 |
250 |
640 |
890 |
296.7 |
SCORING
|
|
TD |
FG |
1XP |
2XP |
Tot
|
| Bain |
2 |
0 |
0 |
0 |
12
|
| Pilares |
2 |
0 |
0 |
0 |
12
|
| Kelly |
0 |
1 |
6 |
0 |
9
|
| Salas |
1 |
0 |
0 |
0 |
6
|
| Wright-Jackson |
1 |
0 |
0 |
0 |
6
|
| Lane |
1 |
0 |
0 |
0 |
6
|
| Washington |
0 |
0 |
0 |
1 |
2
|
| Graunke |
0 |
0 |
0 |
1 |
0
|
| Total |
7 |
1 |
6 |
1 |
53 |
PUNTING
|
|
No. |
Yds |
Avg |
Long
|
| Grasso |
16 |
678 |
42.4 |
53
|
| Total |
16 |
678 |
42.4 |
53 |
PUNT RETURNS
|
|
No. |
Yds |
Avg |
TD |
Long
|
| Washington |
4 |
-2 |
-0.5 |
0 |
2
|
| Total |
4 |
-2 |
-0.5 |
0 |
2 |
KICK RETURNS
|
|
No. |
Yds |
Avg |
TD |
Long
|
| Mouton |
10 |
215 |
21.5 |
0 |
29
|
| Taylor |
9 |
34 |
14.9 |
0 |
30
|
| Lane |
1 |
14 |
14.0 |
0 |
14
|
| Total |
20 |
363 |
18.1 |
0 |
30 |
TACKLES
|
|
G |
UT |
AT |
Tot
|
| Veikune |
3 |
12 |
8 |
20
|
| Elimimian |
3 |
6 |
13 |
19
|
| Satele |
3 |
9 |
9 |
18
|
| Robinson |
3 |
8 |
9 |
17
|
| Dowling |
3 |
7 |
9 |
16
|
| Leonard |
3 |
9 |
7 |
16
|
| Monteilh |
3 |
8 |
7 |
15
|
| Roberts |
3 |
11 |
3 |
14
|
| Mouton |
3 |
10 |
4 |
14
|
| Fonoti |
3 |
6 |
7 |
13
|
| Leonard |
3 |
7 |
5 |
12
|
| Watson |
3 |
3 |
4 |
7
|
| Thomas |
3 |
2 |
3 |
5
|
| Kiesel-Kauhane |
3 |
2 |
2 |
4
|
| Tufaga |
3 |
2 |
2 |
4
|
| Allen-Jones |
3 |
2 |
1 |
3
|
| Rego |
3 |
1 |
1 |
2
|
| Clore |
3 |
2 |
0 |
2
|
| Silva |
3 |
1 |
1 |
2
|
| Bryant |
3 |
2 |
0 |
2
|
| Kafentzis |
3 |
0 |
2 |
2
|
| Davis |
3 |
1 |
1 |
2
|
| Kia |
2 |
0 |
1 |
1
|
| Libre |
2 |
0 |
1 |
1
|
| Washington |
3 |
1 |
0 |
1
|
| Ahmad |
3 |
1 |
0 |
1
|
| Smith |
3 |
0 |
1 |
1
|
| Porlas |
3 |
1 |
0 |
1
|
| Kelly |
3 |
1 |
0 |
1
|
| Laeli |
3 |
0 |
1 |
1
|
| Total |
3 |
115 |
102 |
217 |
MISC.
Sacks (No.-Yds): J. Leonard 4-11, Robinson 2.5-17, Veikune 2-4, Satele 1.5-17, Fonoti 1.5-14, Elimimian 1.5-3, A. Leonard 1-8, Mouton 1-4, Watson 0.5-1, Tufaga 0.5-1.
Total: 16-80.
Interceptions (No.-Yds): Bryant 1-11, Monteilh 1-0. Total: 2-11.
Fumbles (Forced-Recovered): None.
Blocked kicks: None.