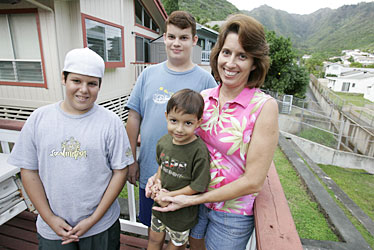
FL MORRIS / FMORRIS@STARBULLETIN.COM
Cathy Cisneros and her sons, Jason, left, Matthew and Luke, at their Kuliouou home. "People don't understand what the public schools have to offer," she said.
|
|
Test scores do not tell whole story
Cathy Cisneros of Kuliouou has never considered putting her kids in private school because she believes her children are getting an excellent education in Hawaii's public schools.
"Just because a child is in private school doesn't mean they are going to do any better than someone in the public school system," she said. "It's the school-child-parent relationship. If one of the three isn't strong, I don't think the child will flourish."
Her sentiments got some backing from two recent national studies that found that students with similar backgrounds performed at roughly the same level academically whether they were in private or public schools.
The first, published in July 2006 by the National Center for Education Statistics, a federal entity, analyzed scores on the National Assessment of Educational Progress taken by fourth- and eighth-graders across the country. It found that while private schools have higher test scores overall than public schools, the difference largely disappeared when student characteristics such as English-language status, disability, gender and ethnicity were taken into account.
For fourth-grade reading and eighth-grade math, the difference in adjusted average scores between public and private schools was not significant. For fourth-grade math the average score was higher for public schools, while for eighth-grade reading it was higher in private schools, when adjusted for student background.
The report had a daunting title, "Comparing Private Schools and Public Schools Using Hierarchical Linear Modeling," and did not grab headlines. But federal law requires regular testing of public school students, and those results always make a news splash.
"I don't think it's fair to say this public school's scores are low, because we take such an array of cultures and backgrounds and personalities," said Cisneros. "You have the special-education kids, all spectrums, and they get put into that rating. You've got the ones who are cutting classes as well as the kids who are pushing hard to make honor roll. That's fine. You're going to have to work with all types of people in life."
The second study, published in October by the Center for Education Policy in Washington, D.C., which advocates for public education, analyzed data from the National Educational Longitudinal Study of 1988-2000. It looked at a representative sample of students over time and their 12th-grade achievement test scores.
It found that low-income students in urban public high schools generally did as well as their peers in private schools, if they had similar eighth-grade test scores, socioeconomic status and level of parental involvement.
"I'm just as vested in my children's education as anyone else," said Cisneros, a stay-at-home mother whose husband is an airline mechanic. Her son Matthew is a freshman at Kaiser High, her son Jason is in eighth grade at Niu Valley Middle and Luke will attend Aina Haina Elementary starting this fall.
"Matthew and Jason are doing very well," she said. "They've had band, they've had Japanese, even in elementary school. They've had art classes. People don't understand what the public schools have to offer."
Private matter
Private school enrollment by state (percentage of private school enrollment to total enrollment).
| State |
PCT.% |
| Alabama |
12% |
| Alaska |
7% |
| Arizona |
7% |
| Arkansas |
9% |
| California |
9% |
| Colorado |
9% |
| Connecticut |
11% |
| Delaware |
19% |
| District of Columbia |
19% |
| Florida |
12% |
| Georgia |
10% |
| Hawaii |
18% |
| Idaho |
8% |
| Illinois |
12% |
| Indiana |
12% |
| Iowa |
10% |
| Kansas |
11% |
| Kentucky |
12% |
| Louisiana |
17% |
| Maine |
8% |
| Maryland |
17% |
| Massachusetts |
12% |
| Michigan |
10% |
| Minnesota |
11% |
| Mississippi |
10% |
| Missouri |
14% |
| Montana |
4% |
| Nebraska |
13% |
| Nevada |
5% |
| New Hampshire |
10% |
| New Jersey |
13% |
| New Mexico |
8% |
| New York |
15% |
| North Carolina |
8% |
| North Dakota |
8% |
| Ohio |
13% |
| Oklahoma |
7% |
| Oregon |
9% |
| Pennsylvania |
15% |
| Rhode Island |
14% |
| South Carolina |
10% |
| South Dakota |
9% |
| Tennessee |
11% |
| Texas |
7% |
| Utah |
4% |
| Vermont |
9% |
| Virginia |
10% |
| Washington |
9% |
| West Virginia |
7% |
| Wisconsin |
13% |
| Wyoming |
6% |
| National average |
11% |
Source: Star-Bulletin analysis of Census Bureau data from the 2006 American Community Survey.