
Ferry rides tide of favor
The Star-Bulletin Hawaii Superferry poll was conducted Sept. 27 through Oct. 2 by SMS Research. A total of 600 telephone surveys were conducted statewide, 150 each on Oahu, Maui, the Big Island and Kauai. The margin of error is 4 percentage points for the statewide poll and about 8 percentage points for the individual islands.
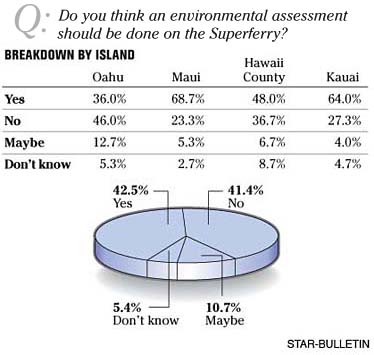
Do you think an environmental assessment should be done on the Superferry?
Additional demographic data:
Age and Gender
| Gender | What is your age? | Total | ||||||||
| Male | Female | 18 to 34 | 35 to 44 | 45 to 54 | 55 to 64 | 65 or older | Don't know | |||
| Yes | 38.5% | 45.5% | 57.7% | 61.4% | 40.6% | 33.5% | 30.7% | 53.0% | 42.5% | |
| No | 45.7% | 38.2% | 26.8% | 25.6% | 39.7% | 54.9% | 51.4% | 23.5% | 41.4% | |
| Maybe | 9.5% | 11.5% | 10.7% | 12.4% | 12.3% | 10.8% | 8.2% | 10.7% | ||
| Don't know | 6.3% | 4.8% | 4.8% | 0.5% | 7.4% | 0.7% | 9.7% | 23.5% | 5.4% | |
| Total | Sample size | 255 | 345 | 75 | 91 | 172 | 134 | 122 | 6 | 600 |
Ethnicity
| Ethnicity | Total | |||||||||||||
| Caucasian | Chinese | Filipino | Hawaiian or Part-Hawaiian | Japanese | Korean | Samoan | Black or African-American | Hispanic or Latino | "Mixed, not Hawaiian" | Other | Refused | |||
| Yes | 44.7% | 58.7% | 39.0% | 46.5% | 36.2% | 55.8% | 100.0% | 33.3% | 68.0% | 68.6% | 46.1% | 37.7% | 42.5% | |
| No | 43.8% | 33.9% | 34.3% | 38.5% | 40.6% | 41.5% | 33.3% | 3.5% | 29.3% | 37.2% | 47.5% | 41.4% | ||
| Maybe | 8.7% | 6.1% | 24.5% | 8.8% | 15.0% | 33.3% | 25.0% | 5.8% | 2.0% | 10.7% | ||||
| Don't know | 2.8% | 1.3% | 2.3% | 6.3% | 8.2% | 2.7% | 3.5% | 2.0% | 10.9% | 12.8% | 5.4% | |||
| Total | Sample size | 266 | 38 | 84 | 124 | 110 | 7 | 3 | 3 | 21 | 6 | 59 | 18 | 600 |
Income
| What was your household income in 2006? | Total | ||||||||||
| Less than $25K | $25K to $50K | $50K-$75K | 75K-$100K | $100K-$150K | $150K-$250K | More than $250K | Don't know | Refused | |||
| Yes | 50.2% | 32.8% | 47.0% | 46.3% | 45.6% | 75.0% | 24.9% | 35.3% | 34.5% | 42.5% | |
| No | 24.6% | 45.1% | 43.5% | 46.7% | 39.2% | 8.6% | 70.9% | 26.4% | 47.8% | 41.4% | |
| Maybe | 14.3% | 16.3% | 8.7% | 1.4% | 9.6% | 4.3% | 24.8% | 12.7% | 10.7% | ||
| Don't know | 11.0% | 5.8% | 0.7% | 5.6% | 5.5% | 16.4% | 13.6% | 5.0% | 5.4% | ||
| Total | Sample size | 6800.0% | 12500.0% | 13500.0% | 7900.0% | 5600.0% | 1400.0% | 1300.0% | 2000.0% | 9000.0% | 60000.0% |
Island
| Island | Total | ||||
| Oahu | Maui | Hawaii Island | Kauai | Percent | |
| Percent | Percent | Percent | Percent | ||
| Yes | 36.0% | 68.7% | 48.0% | 64.0% | 42.5% |
| No | 46.0% | 23.3% | 36.7% | 27.3% | 41.4% |
| Maybe | 12.7% | 5.3% | 6.7% | 4.0% | 10.7% |
| Don't know | 5.3% | 2.7% | 8.7% | 4.7% | 5.4% |
Years in Hawaii
| How long have you lived on this island? | Total | |||||||
| Less than 5 years | 6 to 10 years | 10 to 20 years | "More than 20 years, but not lifetime" | Lifetime | Don't know | |||
| Yes | 47.7% | 42.8% | 62.2% | 41.6% | 36.8% | 100.0% | 42.5% | |
| No | 37.5% | 53.2% | 18.5% | 48.8% | 42.7% | 41.4% | ||
| Maybe | 7.3% | 1.5% | 17.2% | 5.9% | 13.3% | 10.7% | ||
| Don't know | 7.5% | 2.5% | 2.1% | 3.7% | 7.1% | 5.4% | ||
| Total | Sample size | 66 | 50 | 86 | 154 | 242 | 2 | 600 |
Political Philosophy
| Would you say that you are... | Total | |||||||
| Very conservative | Somewhat conservative | Middle of the road | Somewhat liberal | Very liberal | Don't know | |||
| Yes | 34.8% | 40.2% | 38.9% | 57.1% | 39.8% | 43.5% | 42.5% | |
| No | 52.7% | 42.1% | 43.0% | 31.2% | 43.7% | 39.1% | 41.4% | |
| Maybe | 9.5% | 9.0% | 12.3% | 8.7% | 16.5% | 8.0% | 10.7% | |
| Don't know | 3.1% | 8.7% | 5.8% | 3.1% | 9.5% | 5.4% | ||
| Total | Sample size | 70 | 126 | 209 | 120 | 45 | 30 | 600 |
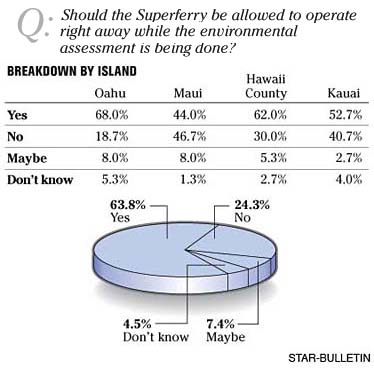
Should the Superferry be allowed to operate right away while the environmental assessment is being done?
Additional demographic data:
Age and Gender
| Gender | What is your age? | Total | ||||||||
| Male | Female | 18 to 34 | 35 to 44 | 45 to 54 | 55 to 64 | 65 or older | Don't know | |||
| Yes | 69.5% | 59.7% | 39.0% | 62.2% | 63.1% | 78.3% | 66.3% | 53.0% | 63.8% | |
| No | 20.8% | 26.8% | 41.6% | 32.7% | 23.9% | 16.4% | 17.1% | 23.5% | 24.3% | |
| Maybe | 5.7% | 8.6% | 14.8% | 4.6% | 7.0% | 0.4% | 13.3% | 7.4% | ||
| Don't know | 3.9% | 4.9% | 4.7% | 0.5% | 6.0% | 4.8% | 3.4% | 23.5% | 4.5% | |
| Total | Sample size | 255 | 345 | 75 | 91 | 172 | 134 | 122 | 6 | 600 |
Ethnicity
| Ethnicity | Total | |||||||||||||
| Caucasian | Chinese | Filipino | Hawaiian or Part-Hawaiian | Japanese | Korean | Samoan | Black or African-American | Hispanic or Latino | "Mixed, not Hawaiian" | Other | Refused | |||
| Yes | 64.7% | 76.1% | 66.2% | 55.0% | 59.8% | 92.9% | 5.7% | 100.0% | 10.7% | 66.1% | 80.9% | 52.7% | 63.8% | |
| No | 27.5% | 23.9% | 20.9% | 36.3% | 21.0% | 7.1% | 81.7% | 63.8% | 4.5% | 15.2% | 18.4% | 24.3% | ||
| Maybe | 6.0% | 12.7% | 6.2% | 11.6% | 12.6% | 25.5% | 3.0% | 2.4% | 7.4% | |||||
| Don't know | 1.9% | 0.2% | 2.5% | 7.6% | 29.3% | 1.0% | 26.5% | 4.5% | ||||||
| Total | Sample size | 266 | 38 | 84 | 124 | 110 | 7 | 3 | 3 | 21 | 6 | 59 | 18 | 600 |
Income
| What was your household income in 2006? | Total | ||||||||||
| Less than $25K | $25K to $50K | $50K-$75K | 75K-$100K | $100K-$150K | $150K-$250K | More than $250K | Don't know | Refused | |||
| Yes | 46.8% | 63.9% | 67.8% | 64.3% | 65.8% | 56.3% | 80.2% | 45.0% | 70.3% | 63.8% | |
| No | 25.7% | 23.1% | 25.8% | 30.1% | 24.0% | 29.9% | 13.6% | 40.9% | 13.9% | 24.3% | |
| Maybe | 20.4% | 10.2% | 5.6% | 5.4% | 9.3% | 4.3% | 1.8% | 3.4% | 7.4% | ||
| Don't know | 7.1% | 2.8% | 0.8% | 0.2% | 0.9% | 13.9% | 1.9% | 12.3% | 12.5% | 4.5% | |
| Total | Sample size | 68 | 125 | 135 | 79 | 56 | 14 | 13 | 20 | 90 | 600 |
Island
| Island | Total | ||||
| Oahu | Maui | Hawaii Island | Kauai | Percent | |
| Percent | Percent | Percent | Percent | ||
| Yes | 68.0% | 44.0% | 62.0% | 52.7% | 63.8% |
| No | 18.7% | 46.7% | 30.0% | 40.7% | 24.3% |
| Maybe | 8.0% | 8.0% | 5.3% | 2.7% | 7.4% |
| Don't know | 5.3% | 1.3% | 2.7% | 4.0% | 4.5% |
Years in Hawaii
| How long have you lived on this island? | Total | |||||||
| Less than 5 years | 6 to 10 years | 10 to 20 years | "More than 20 years, but not lifetime" | Lifetime | Don't know | |||
| Yes | 65.2% | 55.6% | 65.2% | 65.3% | 64.0% | 63.8% | ||
| No | 19.4% | 39.6% | 29.0% | 26.8% | 20.4% | 100.0% | 24.3% | |
| Maybe | 12.8% | 4.9% | 1.6% | 5.1% | 9.4% | 7.4% | ||
| Don't know | 2.6% | 4.1% | 2.8% | 6.3% | 4.5% | |||
| Total | Sample size | 66 | 50 | 86 | 154 | 242 | 2 | 600 |
Political Philosophy
| Would you say that you are... | Total | |||||||
| Very conservative | Somewhat conservative | Middle of the road | Somewhat liberal | Very liberal | Don't know | |||
| Yes | 66.6% | 63.3% | 65.6% | 61.7% | 66.4% | 47.0% | 63.8% | |
| No | 27.1% | 20.8% | 21.7% | 29.7% | 23.3% | 41.6% | 24.3% | |
| Maybe | 5.1% | 9.1% | 8.2% | 3.4% | 9.8% | 11.4% | 7.4% | |
| Don't know | 1.2% | 6.7% | 4.6% | 5.2% | 0.5% | 4.5% | ||
| Total | Sample size | 70 | 126 | 209 | 120 | 45 | 30 | 600 |
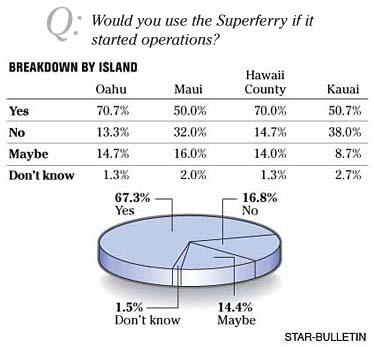
Would you use the Superferry if it started operations?
Additional demographic data:
Age and Gender
| Gender | What is your age? | Total | ||||||||
| Male | Female | 18 to 34 | 35 to 44 | 45 to 54 | 55 to 64 | 65 or older | Don't know | |||
| Yes | 73.8% | 62.6% | 73.3% | 62.0% | 71.5% | 73.0% | 56.7% | 76.5% | 67.3% | |
| No | 12.2% | 20.1% | 17.7% | 29.9% | 10.8% | 14.5% | 17.7% | 16.8% | ||
| Maybe | 13.4% | 15.2% | 7.4% | 8.1% | 17.6% | 11.6% | 23.0% | 14.4% | ||
| Don't know | 0.6% | 2.1% | 1.7% | 0.1% | 0.9% | 2.6% | 23.5% | 1.5% | ||
| Total | Sample size | 255 | 345 | 75 | 91 | 172 | 134 | 122 | 6 | 600 |
Ethnicity
| Ethnicity | Total | |||||||||||||
| Caucasian | Chinese | Filipino | Hawaiian or Part-Hawaiian | Japanese | Korean | Samoan | Black or African-American | Hispanic or Latino | "Mixed, not Hawaiian" | Other | Refused | |||
| Yes | 62.9% | 53.4% | 78.0% | 67.2% | 67.0% | 100.0% | 100.0% | 100.0% | 44.8% | 60.7% | 70.0% | 52.7% | 67.3% | |
| No | 20.0% | 40.1% | 13.8% | 15.5% | 17.8% | 55.2% | 29.3% | 17.4% | 1.8% | 16.8% | ||||
| Maybe | 15.3% | 6.5% | 7.2% | 16.7% | 14.7% | 9.9% | 12.3% | 32.7% | 14.4% | |||||
| Don't know | 1.8% | 1.0% | 0.6% | 0.5% | 0.3% | 12.8% | 1.5% | |||||||
| Total | Sample size | 266 | 38 | 84 | 124 | 110 | 7 | 3 | 3 | 21 | 6 | 59 | 18 | 600 |
Income
| What was your household income in 2006? | Total | ||||||||||
| Less than $25K | $25K to $50K | $50K-$75K | 75K-$100K | $100K-$150K | $150K-$250K | More than $250K | Don't know | Refused | |||
| Yes | 73.8% | 62.9% | 64.1% | 62.4% | 73.7% | 67.6% | 89.6% | 67.2% | 71.3% | 67.3% | |
| No | 19.1% | 20.8% | 10.9% | 29.3% | 13.5% | 32.4% | 6.2% | 16.6% | 9.4% | 16.8% | |
| Maybe | 6.1% | 15.6% | 22.5% | 8.1% | 12.8% | 4.3% | 16.2% | 15.5% | 14.4% | ||
| Don't know | 1.0% | 0.7% | 2.6% | 0.2% | 3.8% | 1.5% | |||||
| Total | Sample size | 68 | 125 | 135 | 79 | 56 | 14 | 13 | 20 | 90 | 600 |
Island
| Island | Total | ||||
| Oahu | Maui | Hawaii Island | Kauai | Percent | |
| Percent | Percent | Percent | Percent | ||
| Yes | 70.7% | 50.0% | 70.0% | 50.7% | 67.3% |
| No | 13.3% | 32.0% | 14.7% | 38.0% | 16.8% |
| Maybe | 14.7% | 16.0% | 14.0% | 8.7% | 14.4% |
| Don't know | 1.3% | 2.0% | 1.3% | 2.7% | 1.5% |
Years in Hawaii
| How long have you lived on this island? | Total | |||||||
| Less than 5 years | 6 to 10 years | 10 to 20 years | "More than 20 years, but not lifetime" | Lifetime | Don't know | |||
| Yes | 76.1% | 69.1% | 62.4% | 69.6% | 66.2% | 67.3% | ||
| No | 11.8% | 19.1% | 24.6% | 17.0% | 15.6% | 6.5% | 16.8% | |
| Maybe | 11.2% | 11.1% | 6.9% | 13.4% | 17.8% | 14.4% | ||
| Don't know | 0.8% | 0.7% | 6.1% | 0.4% | 93.5% | 1.5% | ||
| Total | Sample size | 66 | 50 | 86 | 154 | 242 | 2 | 600 |
Political Philosophy
| Would you say that you are... | Total | |||||||
| Very conservative | Somewhat conservative | Middle of the road | Somewhat liberal | Very liberal | Don't know | |||
| Yes | 75.1% | 67.5% | 66.4% | 64.8% | 72.0% | 57.2% | 67.3% | |
| No | 15.3% | 19.5% | 15.9% | 16.9% | 12.4% | 17.5% | 16.8% | |
| Maybe | 8.9% | 12.9% | 16.9% | 15.1% | 15.7% | 9.0% | 14.4% | |
| Don't know | 0.7% | 0.8% | 3.1% | 16.3% | 1.5% | |||
| Total | Sample size | 70 | 126 | 209 | 120 | 45 | 30 | 600 |