
Superferry stirs political waters
Second of Two Parts
The Star-Bulletin Hawaii Superferry poll was conducted Sept. 27 through Tuesday by SMS Research. A total of 600 telephone surveys were conducted statewide, 150 each on Oahu, Maui, the Big Island and Kauai. The margin of error is 4 percentage points for the statewide poll and about 8 percentage points for the individual islands. Statewide totals were weighted to reflect the relative population of the islands.
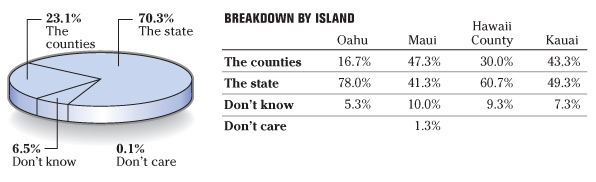
Do you feel that each individual county should have control over whether the Superferry goes to their island?
Age and Gender
|
|
Gender |
What is your age? |
Total |
|
|
Male |
Female |
18 to 34 |
35 to 44 |
45 to 54 |
55 to 64 |
65 or older |
Don't know |
|
|
The counties |
19.7% |
25.5% |
17.3% |
27.8% |
30.2% |
20.6% |
18.4% |
|
23.1% |
|
The State |
75.3% |
66.7% |
66.4% |
71.4% |
62.9% |
73.0% |
77.5% |
76.5% |
70.3% |
|
Don't know |
4.6% |
7.8% |
16.3% |
0.7% |
6.9% |
6.4% |
3.4% |
23.5% |
6.5% |
|
Don't care |
0.3% |
|
|
|
|
|
0.7% |
|
0.1% |
| Total |
Sample size |
255 |
345 |
75 |
91 |
172 |
134 |
122 |
6 |
600 |
Ethnicity
|
|
Ethnicity |
Total |
|
|
Caucasian |
Chinese |
Filipino |
Hawaiian or Part-Hawaiian |
Japanese |
Korean |
Samoan |
Black or African-American |
Hispanic or Latino |
"Mixed, not Hawaiian" |
Other |
Refused |
|
|
The counties |
26.4% |
32.9% |
10.8% |
29.7% |
23.0% |
9.8% |
12.6% |
66.7% |
23.5% |
12.0% |
33.7% |
13.7% |
23.1% |
|
The State |
66.9% |
60.5% |
81.3% |
63.0% |
72.1% |
83.0% |
87.4% |
33.3% |
70.6% |
88.0% |
60.4% |
58.7% |
70.3% |
|
Don't know |
6.5% |
6.6% |
7.8% |
6.9% |
4.6% |
7.1% |
|
|
5.9% |
|
5.9% |
27.6% |
6.5% |
|
Don't care |
0.2% |
|
|
0.4% |
0.3% |
|
|
|
|
|
|
|
0.1% |
| Total |
Sample size |
266 |
38 |
84 |
124 |
110 |
7 |
3 |
3 |
21 |
6 |
59 |
18 |
600 |
Income
|
|
What was your household income in 2006? |
Total |
|
|
Less than $25K |
$25K to $50K |
$50K-$75K |
75K-$100K |
$100K-$150K |
$150K-$250K |
More than $250K |
Don't know |
Refused |
|
|
The counties |
33.7% |
22.8% |
20.0% |
35.9% |
12.4% |
16.4% |
8.5% |
7.6% |
25.3% |
23.1% |
|
The State |
58.6% |
71.1% |
70.8% |
60.6% |
81.9% |
81.4% |
86.4% |
87.1% |
67.2% |
70.3% |
|
Don't know |
7.7% |
6.0% |
9.1% |
3.5% |
5.7% |
|
5.1% |
3.5% |
7.5% |
6.5% |
|
Don't care |
|
|
|
|
|
2.1% |
|
1.8% |
|
0.1% |
| Total |
Sample size |
68 |
125 |
135 |
79 |
56 |
14 |
13 |
20 |
90 |
600 |
Island
|
Island |
|
|
|
Total |
|
Oahu |
Maui |
Hawaii Island |
Kauai |
Percent |
|
Percent |
Percent |
Percent |
Percent |
|
| The counties |
16.7% |
47.3% |
30.0% |
43.3% |
23.1% |
| The State |
78.0% |
41.3% |
60.7% |
49.3% |
70.3% |
| Don't know |
5.3% |
10.0% |
9.3% |
7.3% |
6.5% |
| Don't care |
|
1.3% |
|
|
0.1% |
Years in Hawaii
|
|
How long have you lived on this island? |
Total |
|
|
Less than 5 years |
6 to 10 years |
10 to 20 years |
"More than 20 years, but not lifetime" |
Lifetime |
Don't know |
|
|
The counties |
31.4% |
18.7% |
39.0% |
17.3% |
21.6% |
6.5% |
23.1% |
|
The State |
66.2% |
72.2% |
54.4% |
77.5% |
71.4% |
|
70.3% |
|
Don't know |
2.4% |
7.6% |
6.6% |
4.9% |
7.0% |
93.5% |
6.5% |
|
Don't care |
|
1.5% |
|
0.3% |
|
|
0.1% |
| Total |
Sample size |
66 |
50 |
86 |
154 |
242 |
2 |
600 |
Political Philosophy
|
|
Would you say that you are... |
Total |
|
|
Very conservative |
Somewhat conservative |
Middle of the road |
Somewhat liberal |
Very liberal |
Don't know |
|
|
The counties |
6.7% |
26.5% |
21.2% |
28.6% |
29.5% |
23.6% |
23.1% |
|
The State |
76.5% |
71.3% |
70.7% |
69.1% |
67.7% |
51.1% |
70.3% |
|
Don't know |
16.9% |
2.2% |
8.1% |
2.4% |
1.6% |
23.0% |
6.5% |
|
Don't care |
|
|
|
|
1.1% |
2.4% |
0.1% |
| Total |
Sample size |
70 |
126 |
209 |
120 |
45 |
30 |
600 |
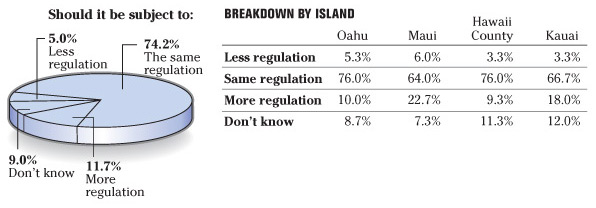
Should the Superferry be subject to the same rules and regulations that other commercial ships and vessels are subject to?
Age and Gender
|
|
Gender |
What is your age? |
Total |
|
|
Male |
Female |
18 to 34 |
35 to 44 |
45 to 54 |
55 to 64 |
65 or older |
Don't know |
|
|
Less regulation |
5.3% |
4.9% |
3.2% |
4.4% |
4.8% |
3.3% |
8.9% |
|
5.0% |
|
Same regulation |
76.5% |
72.5% |
73.5% |
80.1% |
69.4% |
78.2% |
72.3% |
76.5% |
74.2% |
|
More regulation |
11.8% |
11.6% |
18.3% |
13.5% |
17.2% |
8.0% |
4.7% |
|
11.7% |
|
Don't know |
6.4% |
10.9% |
5.1% |
1.9% |
8.6% |
10.6% |
14.0% |
23.5% |
9.0% |
| Total |
Sample size |
255 |
345 |
75 |
91 |
172 |
134 |
122 |
6 |
600 |
Ethnicity
|
|
Ethnicity |
Total |
|
|
Caucasian |
Chinese |
Filipino |
Hawaiian or Part-Hawaiian |
Japanese |
Korean |
Samoan |
Black or African-American |
Hispanic or Latino |
"Mixed, not Hawaiian" |
Other |
Refused |
|
|
Less regulation |
6.5% |
|
4.7% |
7.9% |
2.7% |
2.7% |
|
|
|
31.4% |
5.7% |
2.0% |
5.0% |
|
Same regulation |
77.2% |
85.9% |
75.6% |
71.0% |
70.5% |
97.3% |
18.3% |
33.3% |
83.4% |
34.7% |
76.3% |
88.1% |
74.2% |
|
More regulation |
10.6% |
13.3% |
9.8% |
13.7% |
14.1% |
|
81.7% |
66.7% |
8.8% |
4.5% |
10.9% |
2.9% |
11.7% |
|
Don't know |
5.7% |
0.8% |
9.9% |
7.4% |
12.7% |
|
|
|
7.8% |
29.3% |
7.2% |
7.1% |
9.0% |
| Total |
Sample size |
266 |
38 |
84 |
124 |
110 |
7 |
3 |
3 |
21 |
6 |
59 |
18 |
600 |
Income
|
|
What was your household income in 2006? |
Total |
|
|
Less than $25K |
$25K to $50K |
$50K-$75K |
75K-$100K |
$100K-$150K |
$150K-$250K |
More than $250K |
Don't know |
Refused |
|
|
Less regulation |
4.2% |
9.8% |
7.4% |
7.2% |
0.7% |
|
|
|
0.5% |
5.0% |
|
Same regulation |
58.6% |
71.6% |
80.5% |
68.4% |
83.3% |
83.0% |
90.7% |
47.7% |
78.5% |
74.2% |
|
More regulation |
20.5% |
13.6% |
10.3% |
11.4% |
8.6% |
2.1% |
4.3% |
27.7% |
7.6% |
11.7% |
|
Don't know |
16.7% |
4.9% |
1.8% |
13.0% |
7.4% |
14.8% |
5.1% |
24.6% |
13.4% |
9.0% |
| Total |
Sample size |
68 |
125 |
135 |
79 |
56 |
14 |
13 |
20 |
90 |
600 |
Island
|
Island |
|
|
|
Total |
|
Oahu |
Maui |
Hawaii Island |
Kauai |
Percent |
|
Percent |
Percent |
Percent |
Percent |
|
| Less regulation |
5.3% |
6.0% |
3.3% |
3.3% |
5.0% |
| Same regulation |
76.0% |
64.0% |
76.0% |
66.7% |
74.2% |
| More regulation |
10.0% |
22.7% |
9.3% |
18.0% |
11.7% |
| Don't know |
8.7% |
7.3% |
11.3% |
12.0% |
9.0% |
Years in Hawaii
|
|
How long have you lived on this island? |
Total |
|
|
Less than 5 years |
6 to 10 years |
10 to 20 years |
"More than 20 years, but not lifetime" |
Lifetime |
Don't know |
|
|
Less regulation |
6.3% |
5.6% |
5.7% |
4.4% |
5.0% |
|
5.0% |
|
Same regulation |
84.5% |
77.3% |
73.6% |
72.5% |
73.0% |
93.5% |
74.2% |
|
More regulation |
7.7% |
8.9% |
14.3% |
11.5% |
12.3% |
6.5% |
11.7% |
|
Don't know |
1.5% |
8.2% |
6.4% |
11.6% |
9.8% |
|
9.0% |
| Total |
Sample size |
66 |
50 |
86 |
154 |
242 |
2 |
600 |
Political Philosophy
|
|
Would you say that you are... |
Total |
|
|
Very conservative |
Somewhat conservative |
Middle of the road |
Somewhat liberal |
Very liberal |
Don't know |
|
|
Less regulation |
3.0% |
6.4% |
4.7% |
6.5% |
2.5% |
1.1% |
5.0% |
|
Same regulation |
73.1% |
76.7% |
75.8% |
70.5% |
68.5% |
74.9% |
74.2% |
|
More regulation |
12.4% |
7.0% |
11.2% |
13.8% |
25.0% |
10.7% |
11.7% |
|
Don't know |
11.5% |
9.8% |
8.3% |
9.2% |
4.0% |
13.3% |
9.0% |
| Total |
Sample size |
70 |
126 |
209 |
120 |
45 |
30 |
600 |
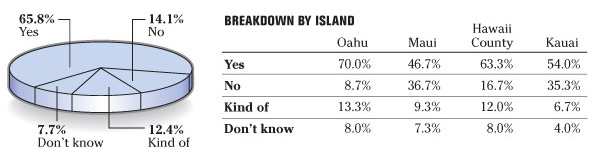
Do you feel that the Superferry has been treated unfairly?
Age and Gender
|
|
Gender |
What is your age? |
Total |
|
|
Male |
Female |
18 to 34 |
35 to 44 |
45 to 54 |
55 to 64 |
65 or older |
Don't know |
|
|
Yes |
72.5% |
60.8% |
80.5% |
60.2% |
63.3% |
76.0% |
56.7% |
53.0% |
65.8% |
|
No |
9.8% |
17.3% |
10.0% |
19.1% |
18.9% |
8.9% |
12.8% |
|
14.1% |
|
Kind of |
10.4% |
13.9% |
7.8% |
12.2% |
8.6% |
7.7% |
23.0% |
23.5% |
12.4% |
|
Don't know |
7.3% |
8.0% |
1.7% |
8.5% |
9.2% |
7.4% |
7.5% |
23.5% |
7.7% |
| Total |
Sample size |
255 |
345 |
75 |
91 |
172 |
134 |
122 |
6 |
600 |
Ethnicity
|
|
Ethnicity |
Total |
|
|
Caucasian |
Chinese |
Filipino |
Hawaiian or Part-Hawaiian |
Japanese |
Korean |
Samoan |
Black or African-American |
Hispanic or Latino |
"Mixed, not Hawaiian" |
Other |
Refused |
|
|
Yes |
65.5% |
59.5% |
76.4% |
58.9% |
61.3% |
97.3% |
100.0% |
66.7% |
52.1% |
60.7% |
72.2% |
50.7% |
65.8% |
|
No |
16.7% |
25.7% |
12.9% |
14.7% |
13.4% |
|
|
33.3% |
18.7% |
4.5% |
15.6% |
3.2% |
14.1% |
|
Kind of |
12.8% |
1.1% |
5.2% |
14.5% |
15.1% |
|
|
|
22.0% |
29.3% |
9.3% |
17.1% |
12.4% |
|
Don't know |
5.0% |
13.8% |
5.5% |
11.9% |
10.2% |
2.7% |
|
|
7.2% |
5.4% |
2.9% |
28.9% |
7.7% |
| Total |
Sample size |
266 |
38 |
84 |
124 |
110 |
7 |
3 |
3 |
21 |
6 |
59 |
18 |
600 |
Income
|
|
What was your household income in 2006? |
Total |
|
|
Less than $25K |
$25K to $50K |
$50K-$75K |
75K-$100K |
$100K-$150K |
$150K-$250K |
More than $250K |
Don't know |
Refused |
|
|
Yes |
67.1% |
67.8% |
61.4% |
64.5% |
74.0% |
53.7% |
84.5% |
73.5% |
63.8% |
65.8% |
|
No |
13.3% |
15.2% |
20.9% |
11.3% |
12.8% |
2.1% |
8.5% |
6.9% |
11.1% |
14.1% |
|
Kind of |
8.0% |
10.8% |
8.5% |
17.8% |
7.4% |
41.6% |
1.9% |
17.5% |
14.7% |
12.4% |
|
Don't know |
11.6% |
6.2% |
9.2% |
6.4% |
5.7% |
2.5% |
5.1% |
2.1% |
10.4% |
7.7% |
| Total |
Sample size |
68 |
125 |
135 |
79 |
56 |
14 |
13 |
20 |
90 |
600 |
Island
|
Island |
|
|
|
Total |
|
Oahu |
Maui |
Hawaii Island |
Kauai |
Percent |
|
Percent |
Percent |
Percent |
Percent |
|
| Yes |
70.0% |
46.7% |
63.3% |
54.0% |
65.8% |
| No |
8.7% |
36.7% |
16.7% |
35.3% |
14.1% |
| Kind of |
13.3% |
9.3% |
12.0% |
6.7% |
12.4% |
| Don't know |
8.0% |
7.3% |
8.0% |
4.0% |
7.7% |
Years in Hawaii
|
|
How long have you lived on this island? |
Total |
|
|
Less than 5 years |
6 to 10 years |
10 to 20 years |
"More than 20 years, but not lifetime" |
Lifetime |
Don't know |
|
|
Yes |
66.8% |
70.9% |
62.0% |
68.8% |
65.0% |
|
65.8% |
|
No |
14.9% |
14.3% |
26.1% |
10.5% |
13.1% |
6.5% |
14.1% |
|
Kind of |
16.0% |
13.3% |
6.2% |
13.3% |
11.8% |
93.5% |
12.4% |
|
Don't know |
2.4% |
1.5% |
5.7% |
7.4% |
10.1% |
|
7.7% |
| Total |
Sample size |
66 |
50 |
86 |
154 |
242 |
2 |
600 |
Political Philosophy
|
|
Would you say that you are... |
Total |
|
|
Very conservative |
Somewhat conservative |
Middle of the road |
Somewhat liberal |
Very liberal |
Don't know |
|
|
Yes |
73.7% |
70.5% |
70.1% |
54.7% |
52.4% |
49.8% |
65.8% |
|
No |
7.7% |
12.7% |
11.8% |
20.4% |
18.6% |
23.1% |
14.1% |
|
Kind of |
10.9% |
10.9% |
7.8% |
19.3% |
23.8% |
16.3% |
12.4% |
|
Don't know |
7.7% |
5.9% |
10.3% |
5.6% |
5.2% |
10.8% |
7.7% |
| Total |
Sample size |
70 |
126 |
209 |
120 |
45 |
30 |
600 |
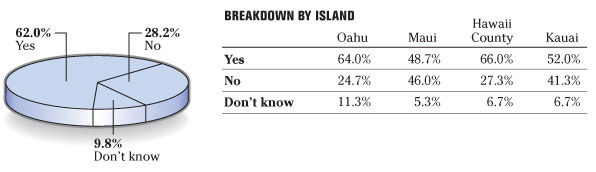
Do you think a special session by the Legislature to allow the Superferry to start operating is a good idea?
Age and Gender
|
|
Gender |
What is your age? |
Total |
|
|
Male |
Female |
18 to 34 |
35 to 44 |
45 to 54 |
55 to 64 |
65 or older |
Don't know |
|
|
Yes |
61.2% |
62.6% |
47.3% |
58.5% |
60.9% |
70.2% |
67.0% |
48.7% |
62.0% |
|
No |
26.3% |
29.5% |
41.7% |
37.2% |
30.7% |
17.9% |
21.1% |
27.8% |
28.2% |
|
Don't know |
12.5% |
7.9% |
11.0% |
4.3% |
8.4% |
11.9% |
11.9% |
23.5% |
9.8% |
| Total |
Sample size |
255 |
345 |
75 |
91 |
172 |
134 |
122 |
6 |
600 |
Ethnicity
|
|
Ethnicity |
Total |
|
|
Caucasian |
Chinese |
Filipino |
Hawaiian or Part-Hawaiian |
Japanese |
Korean |
Samoan |
Black or African-American |
Hispanic or Latino |
"Mixed, not Hawaiian" |
Other |
Refused |
|
|
Yes |
68.2% |
67.9% |
57.6% |
57.1% |
56.2% |
51.3% |
87.4% |
100.0% |
53.9% |
66.1% |
77.4% |
42.2% |
62.0% |
|
No |
26.5% |
19.8% |
21.4% |
35.8% |
31.5% |
48.7% |
12.6% |
|
42.6% |
4.5% |
21.9% |
42.6% |
28.2% |
|
Don't know |
5.4% |
12.3% |
21.0% |
7.1% |
12.3% |
|
|
|
3.5% |
29.3% |
0.7% |
15.2% |
9.8% |
| Total |
Sample size |
266 |
38 |
84 |
124 |
110 |
7 |
3 |
3 |
21 |
6 |
59 |
18 |
600 |
Income
|
|
What was your household income in 2006? |
Total |
|
|
Less than $25K |
$25K to $50K |
$50K-$75K |
75K-$100K |
$100K-$150K |
$150K-$250K |
More than $250K |
Don't know |
Refused |
|
|
Yes |
62.1% |
68.2% |
59.7% |
70.3% |
55.9% |
70.1% |
80.2% |
45.8% |
55.9% |
62.0% |
|
No |
26.1% |
21.7% |
33.2% |
28.5% |
29.8% |
16.0% |
19.8% |
40.6% |
28.2% |
28.2% |
|
Don't know |
11.9% |
10.1% |
7.2% |
1.2% |
14.3% |
13.9% |
|
13.6% |
15.9% |
9.8% |
| Total |
Sample size |
68 |
125 |
135 |
79 |
56 |
14 |
13 |
20 |
90 |
600 |
Island
|
Island |
|
|
|
Total |
|
Oahu |
Maui |
Hawaii Island |
Kauai |
Percent |
|
Percent |
Percent |
Percent |
Percent |
|
| Yes |
64.0% |
48.7% |
66.0% |
52.0% |
62.0% |
| No |
24.7% |
46.0% |
27.3% |
41.3% |
28.2% |
| Don't know |
11.3% |
5.3% |
6.7% |
6.7% |
9.8% |
Years in Hawaii
|
|
How long have you lived on this island? |
Total |
|
|
Less than 5 years |
6 to 10 years |
10 to 20 years |
"More than 20 years, but not lifetime" |
Lifetime |
Don't know |
|
|
Yes |
79.0% |
67.1% |
66.3% |
61.3% |
58.4% |
|
62.0% |
|
No |
20.2% |
30.9% |
26.3% |
27.9% |
29.2% |
100.0% |
28.2% |
|
Don't know |
0.8% |
2.1% |
7.5% |
10.8% |
12.4% |
|
9.8% |
| Total |
Sample size |
66 |
50 |
86 |
154 |
242 |
2 |
600 |
Political Philosophy
|
|
Would you say that you are... |
Total |
|
|
Very conservative |
Somewhat conservative |
Middle of the road |
Somewhat liberal |
Very liberal |
Don't know |
|
|
Yes |
66.7% |
65.3% |
61.1% |
53.4% |
80.0% |
47.7% |
62.0% |
|
No |
27.1% |
20.4% |
26.8% |
41.3% |
20.0% |
44.0% |
28.2% |
|
Don't know |
6.2% |
14.3% |
12.2% |
5.2% |
|
8.3% |
9.8% |
| Total |
Sample size |
70 |
126 |
209 |
120 |
45 |
30 |
600 |
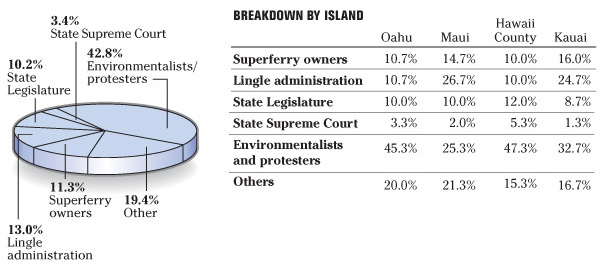
What do you think is most responsible for the Superferry's troubles?
Age and Gender
|
|
Gender |
What is your age? |
Total |
|
|
Male |
Female |
18 to 34 |
35 to 44 |
45 to 54 |
55 to 64 |
65 or older |
Don't know |
|
|
Superferry owners |
12.2% |
10.6% |
15.1% |
10.9% |
15.6% |
6.5% |
9.7% |
|
11.3% |
|
Lingle administration |
9.4% |
15.7% |
4.1% |
15.4% |
10.7% |
20.2% |
13.2% |
|
13.0% |
|
State Legislature |
9.2% |
10.9% |
11.9% |
10.9% |
11.2% |
7.2% |
11.2% |
|
10.2% |
|
State Supreme Court |
3.5% |
3.2% |
1.0% |
5.9% |
2.3% |
5.2% |
2.5% |
|
3.4% |
|
Environmentalists and protesters |
45.9% |
40.5% |
40.9% |
38.4% |
42.2% |
41.7% |
47.8% |
51.3% |
42.8% |
|
Other |
19.7% |
19.1% |
27.0% |
18.5% |
17.9% |
19.1% |
15.5% |
48.7% |
19.4% |
| Total |
Sample size |
255 |
345 |
75 |
91 |
172 |
134 |
122 |
6 |
600 |
Ethnicity
|
|
Ethnicity |
Total |
|
|
Caucasian |
Chinese |
Filipino |
Hawaiian or Part-Hawaiian |
Japanese |
Korean |
Samoan |
Black or African-American |
Hispanic or Latino |
"Mixed, not Hawaiian" |
Other |
Refused |
|
|
Superferry owners |
8.0% |
14.1% |
18.7% |
8.0% |
4.9% |
|
81.7% |
33.3% |
14.7% |
|
20.0% |
4.3% |
11.3% |
|
Lingle administration |
15.9% |
6.9% |
11.3% |
14.7% |
11.7% |
48.7% |
5.7% |
|
28.9% |
|
9.0% |
13.7% |
13.0% |
|
State Legislature |
9.0% |
19.0% |
8.2% |
16.7% |
11.2% |
|
|
|
|
33.9% |
11.9% |
0.9% |
10.2% |
|
State Supreme Court |
5.1% |
5.7% |
3.1% |
2.5% |
2.6% |
|
|
|
|
|
4.6% |
12.8% |
3.4% |
|
Environmentalists and protesters |
42.8% |
34.6% |
41.7% |
33.7% |
43.9% |
41.5% |
12.6% |
66.7% |
47.3% |
31.4% |
37.0% |
39.4% |
42.8% |
|
Other |
19.3% |
19.7% |
16.9% |
24.5% |
25.8% |
9.8% |
|
|
9.1% |
34.7% |
17.4% |
28.9% |
19.4% |
| Total |
Sample size |
266 |
38 |
84 |
124 |
110 |
7 |
3 |
3 |
21 |
6 |
59 |
18 |
600 |
Income
|
|
What was your household income in 2006? |
Total |
|
|
Less than $25K |
$25K to $50K |
$50K-$75K |
75K-$100K |
$100K-$150K |
$150K-$250K |
More than $250K |
Don't know |
Refused |
|
|
Superferry owners |
23.3% |
7.2% |
11.1% |
2.9% |
5.4% |
2.5% |
12.8% |
38.4% |
14.8% |
11.3% |
|
Lingle administration |
5.9% |
18.7% |
13.6% |
4.9% |
16.8% |
27.7% |
10.4% |
|
14.4% |
13.0% |
|
State Legislature |
14.6% |
8.6% |
11.2% |
18.5% |
10.4% |
17.4% |
|
0.8% |
3.1% |
10.2% |
|
State Supreme Court |
1.0% |
3.9% |
2.5% |
1.2% |
0.3% |
|
|
|
10.9% |
3.4% |
|
Environmentalists and protesters |
42.3% |
47.1% |
50.4% |
50.0% |
37.9% |
22.5% |
38.9% |
28.3% |
32.4% |
42.8% |
|
Other |
12.8% |
14.6% |
11.1% |
22.5% |
29.2% |
29.9% |
37.8% |
32.5% |
24.5% |
19.4% |
| Total |
Sample size |
68 |
125 |
135 |
79 |
56 |
14 |
13 |
20 |
90 |
600 |
Island
|
Island |
|
|
|
Total |
|
Oahu |
Maui |
Hawaii Island |
Kauai |
Percent |
|
Percent |
Percent |
Percent |
Percent |
|
| Superferry owners |
10.7% |
14.7% |
10.0% |
16.0% |
11.3% |
| Lingle administration |
10.7% |
26.7% |
10.0% |
24.7% |
13.0% |
| State Legislature |
10.0% |
10.0% |
12.0% |
8.7% |
10.2% |
| State Supreme Court |
3.3% |
2.0% |
5.3% |
1.3% |
3.4% |
| Environmentalists and protesters |
45.3% |
25.3% |
47.3% |
32.7% |
42.8% |
| Other |
20.0% |
21.3% |
15.3% |
16.7% |
19.4% |
Years in Hawaii
|
|
How long have you lived on this island? |
Total |
|
|
Less than 5 years |
6 to 10 years |
10 to 20 years |
"More than 20 years, but not lifetime" |
Lifetime |
Don't know |
|
|
Superferry owners |
18.9% |
3.6% |
19.4% |
10.5% |
9.3% |
|
11.3% |
|
Lingle administration |
9.2% |
9.2% |
21.1% |
16.1% |
10.6% |
|
13.0% |
|
State Legislature |
10.6% |
10.4% |
2.4% |
6.6% |
14.0% |
|
10.2% |
|
State Supreme Court |
1.0% |
1.8% |
5.5% |
5.6% |
2.2% |
|
3.4% |
|
Environmentalists and protesters |
45.9% |
49.4% |
43.0% |
37.6% |
44.8% |
|
42.8% |
|
Other |
14.4% |
25.6% |
8.5% |
23.6% |
19.1% |
100.0% |
19.4% |
| Total |
Sample size |
66 |
50 |
86 |
154 |
242 |
2 |
600 |
Political Philosophy
|
|
Would you say that you are... |
Total |
|
|
Very conservative |
Somewhat conservative |
Middle of the road |
Somewhat liberal |
Very liberal |
Don't know |
|
|
Superferry owners |
13.5% |
9.8% |
8.3% |
10.5% |
33.8% |
8.3% |
11.3% |
|
Lingle administration |
3.4% |
10.0% |
14.2% |
21.1% |
10.0% |
9.6% |
13.0% |
|
State Legislature |
13.2% |
7.9% |
10.7% |
12.0% |
7.8% |
5.6% |
10.2% |
|
State Supreme Court |
7.2% |
4.2% |
2.0% |
3.5% |
2.7% |
|
3.4% |
|
Environmentalists and protesters |
49.6% |
49.5% |
41.9% |
37.0% |
28.4% |
43.8% |
42.8% |
|
Other |
13.1% |
18.6% |
22.8% |
15.8% |
17.3% |
32.6% |
19.4% |
| Total |
Sample size |
70 |
126 |
209 |
120 |
45 |
30 |
600 |