![]()
Think Inc.
A forum for Hawaii's
business community to discuss
current events and issues
![]()
Think Inc.
A forum for Hawaii's
business community to discuss
current events and issues
Car deal or dud? | Using tourism stats BACK TO TOP
|
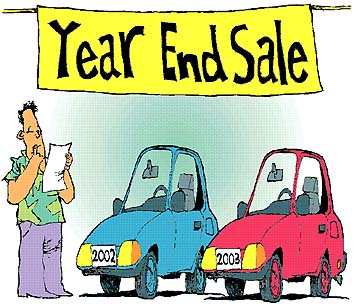
DAVID SWANN / DSWANN@STARBULLETIN.COM You need a new car, and have had your eye on model "C" for months. The dealer is having an end of the model year new car sale, and the discounts being offered look enticing. But are they really a good deal? Deal or dud?
Choosing between a
2002 car or a new modelBy Michael Ottoson
An analysis of the numbers reveal that in some cases, these "deals" on a new 2002 car may end up costing you more money than buying a new 2003 car.
The following example compares hypothetical prices between a new 2002 and 2003 model "C" vehicle with the same equipment. Manufacturer's suggested retail prices listed are for comparison purposes only.
2002 model 2003 model $24,300 $24,600 -$1,600 discount -$800 discount $22,700 net $23,800 net
In the above example, the 2002 model purchase price is $1,100 cheaper than the same 2003 model. On the surface, this seems like the better deal, as both are new cars with a 36 month/36,000 mile manufacturer's new car warranty. However, assuming that 36 months down the road you are going to trade your used car in on another new one, how much more will the 2003 model be worth at trade-in?We don't have a crystal ball to tell us the answer to this question, but we can compare Kelley Blue Values between a three year old and four year old model "C" car today to give us a good idea how much we can expect these two cars to depreciate over the next three years. Remember, although the 2002 model is new when you buy it, it becomes a used car once you drive it off the lot, making the 2002 model car actually one year old the day after you take delivery, or four years old in the Blue Book after only three years.
2000 model 1999 model (3 years old) (4 years old) $15,900 $13,950
In the example above, the 2000 Blue Book price for model "C" is for a 3-year-old car today, while the 1999 Blue Book represents a four year old car today. These Blue Book prices today are the closest estimate of what the 2003 and 2002 model "C" car will be worth three and four years from now.From this example we can deduce that in three years, a 2003 new car purchased today would be worth $1,950 more than a 2002 model purchased today.
So, although you saved an initial $1,100 for the new 2002 model, you end up getting $1,950 less for your trade-in after three years. This represents a net loss of $850.
In conclusion, if you are going to trade your car in after three years (when the new car warranty expires), you might want to consider buying a new 2003 instead of a new 2002 at the end of the model year, as the higher depreciation for the 2002 model will more than offset the higher discount that the car dealer is offering for last year's model.
Remember, always consider how long you plan to keep your car, and what it will be worth when you plan to trade it in before jumping for a dealer's end of the model year discounts. You may be better off paying more for the newest model year car, trade it in after three years on a new one, and save on depreciation and repairs.
Michael Ottoson was in the automobile rental and leasing business in Honolulu for 17 years. BACK TO TOP
|
STAR-BULLETIN FILE / SEPTEMBER 2000
The state already collects considerable data about tourists who come to Hawaii. But what do we know about those who choose somewhere else for their vacations?
It is not uncommon to read news headlines reporting the latest visitor arrival statistics here in Hawaii. Tourism statistics
can be used to gain
on competitionHawaii has made great strides in
gathering data about our visitors; but
we know little about those who choose
someplace else for vacationsBy Joseph D. Patoskie
Tourism is our leading economic industry, and has been for quite some time. Its importance is underscored by the numerous local businesses, public agencies and research departments, which gather statistical information and report to the public on a regular basis.
Over the years, our visitor industry has changed significantly, and great strides have been made to improve the tracking of visitor arrivals and growth trends in our primary markets.
For example, several years ago, refinements in data collection and reporting were initiated within the Department of Business, Economic Development and Tourism, the state's tourism research arm. With the establishment of the Hawaii Tourism Authority in 1998 came a major overhaul in the way Hawaii's tourism statistics were gathered and recorded. Greater emphasis was placed on looking at our Major Market Areas (MMAs) -- e.g., U.S. West, U.S. East, Japan, Canada, Europe, Oceania, etc. -- along with tracking visitor days rather than visitor arrivals as a tool for measuring tourism trends.
While such changes were needed and improved accuracy and accountability have resulted, the focus has remained largely the same -- targeting only those visitors coming to Hawaii. But what about those who are not?
Is it enough to say, for instance, that year-to-date tourism arrivals are up (or down) 2 percent over last year at this time? Using an analogy of a competitive runner, this type of information would tell this individual how his performance compares to his last clocked trial, but not how he measures up to his competitors. As a mature destination facing the high-stakes game of global market share, this is a critical question for Hawaii. Yet, despite our noteworthy advances in analyzing and reporting on our own performance, answers to this important question largely remain left out of the picture.
Without question, Hawaii's natural beauty, unique attractions and cultural experiences are unequaled. The fact remains, however, that we are not the only game in town. We are facing stiff competition from other warm-weather destinations, many of which are more affordable and geographically closer to our MMAs. Yet, we seem almost oblivious to the amount of impact these destinations are creating in our markets.
Indeed, every once in awhile, industry officials will be presented a 'qualitative' visitor perception study carried out by a Mainland research firm. However, the only time it seems that we address our competitors quantitatively, and with any sort of regularity, is during the legislative sessions when more marketing dollars are being sought.
So what are the alternatives? Tracking our competitor's tourism statistics and correlating the information to our own MMAs presents a huge undertaking. Travel data, particularly international, is limited and often difficult to obtain. Furthermore, many competing destinations do not have consistent and reliable visitor statistics.
Nevertheless, there are other options. Rather than trying to obtain visitor numbers directly, there are a number of tourism indicators that exist both with respect to MMAs as well as the competing destinations themselves. Examples include: Growth/decline in room counts vis-ˆ-vis new hotel, condo, and/or time-share construction; new and retiring cruise ships along with ports being served; seasonal and non-seasonal trends in airline seat capacity and frequency of service; specific airline and hotel ads; wholesale packages and special offerings; car rental agency growth; currency exchange rates, etc. This information might then be supplemented with regular visitor surveys of those not necessarily here in Hawaii, but those at these competing destinations who opted not to come.
Eventually, sister relations could be established between Hawaii and representative national tourism organizations at these competitive locations for the primary purpose of sharing statistical, non-proprietary data. Hawaii's information is already public.
The merits of competitive analysis are fairly obvious, but as is the case in most resource-constrained environments, reality paints a different picture.
Despite the ultimate desire to have better information for decision-making, the question becomes one of value: Can we afford to add to what is already a complicated task of data collection and reporting, or can we afford not to? The answer is debatable and quite complex, as is the case with many cost/benefit situations. Either way, it can at least be hoped that the level of awareness on this issue will be raised the next time one reads or hears the latest tourism statistic and contemplates the short and long-term investments being made to make it so.
Joseph D. Patoskie is an associate professor of travel industry management at Hawaii Pacific University. He can be reached at joseph.patoskie@outrigger.com.
To participate in the Think Inc. discussion, e-mail your comments to business@starbulletin.com; fax them to 529-4750; or mail them to Think Inc., Honolulu Star-Bulletin, 7 Waterfront Plaza, Suite 210, 500 Ala Moana, Honolulu, Hawaii 96813. Anonymous submissions will be discarded.